You're reviewing a Phase II report when something catches your eye. The benzene concentration in Table 3 doesn't match what you remember seeing in the laboratory certificate. You pull up the COA. Different number. You check the Excel file the consultant provided. Third number.
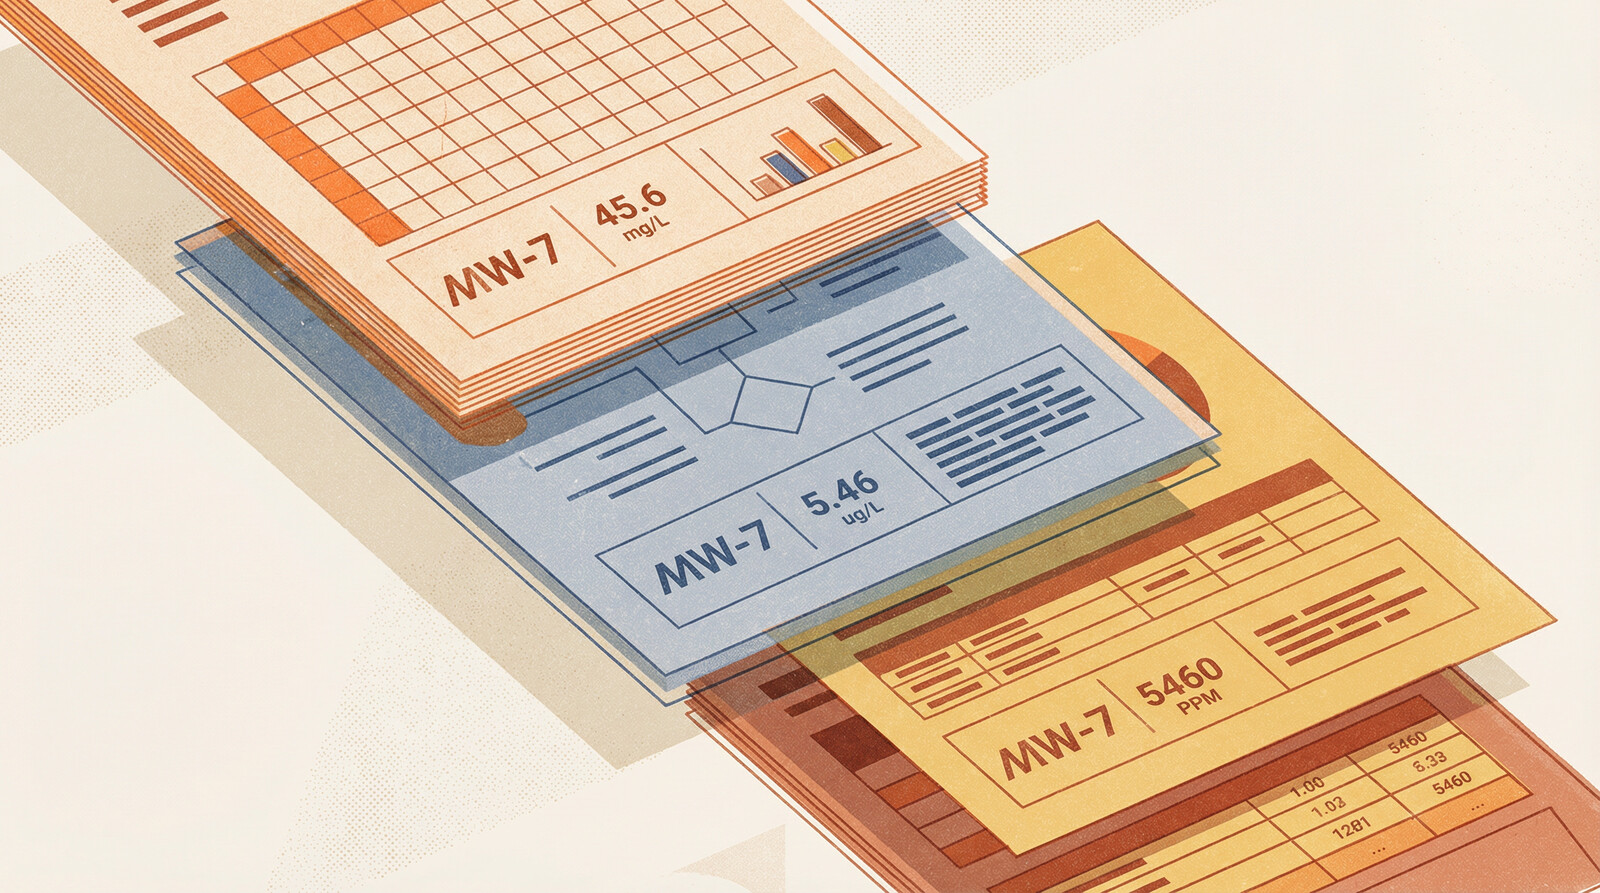
Three documents, three values, same sample.
This happens more often than anyone wants to admit. Data travels from laboratory certificates to consultant reports to summary tables to Excel files, and somewhere along that chain, numbers change. Not because of analytical error or QA/QC failure, but because of transcription mistakes, column shifts, and the inevitable entropy that accumulates when data gets copied between formats.
Traditional quality control checks laboratory procedures. It validates analytical methods, verifies blank results, confirms spike recoveries. What it doesn't catch is when someone pastes data into the wrong column, transposes two samples, or copies values from an outdated version of a table.
The Transcription Chain
Laboratory analysis produces a certificate of analysis (COA). The COA goes to the environmental consultant. The consultant extracts relevant data, summarizes it in a report table, and creates Excel files for further analysis. The site owner receives the report and Excel files. Legal counsel reviews summary tables during discovery. Regulatory agencies see yet another reformatted version.
At each step, data moves from one format to another. PDF to Word. Word to Excel. Excel to PDF. Manual transcription, copy-paste operations, format conversions. Each transfer is an opportunity for error.
The most common mistakes:
Column shifts. Paste data into Excel, and everything shifts one column right. Benzene concentrations become toluene concentrations. Sample IDs misalign with results.
Transposition errors. Sample MW-4 becomes MW-14. Two adjacent rows swap places. A decimal point moves.
Version control failures. Report Table 4 reflects preliminary results. Appendix C shows revised data after the lab corrected a dilution factor. Excel file contains a mix of both versions.
Unit conversions gone wrong. COA reports µg/L. Report converts to mg/L. Excel file treats the converted values as if they're still µg/L and converts them again. Or the dreaded micro being subbed as "m" instead of "µ".
Partial updates. Laboratory reanalyzes three samples. Report updates those three rows. Excel file still contains the original values for those samples.
Why This Matters
Transcription errors aren't just clerical issues. A concentration reported at 850 mg/kg instead of 8,500 mg/kg might mean contamination goes unremediated. The reverse error might trigger unnecessary remediation. Discovery surfaces every version of the data—if opposing counsel finds a laboratory certificate showing benzene at 4,200 µg/L and your report shows 420 µg/L, you need to explain why.
The Scale Problem
Manual cross-checking catches some errors. If you're reviewing a Phase II with 40 samples, you can reasonably compare report tables to laboratory certificates. Time-consuming, but feasible.
When a site investigation spans 800 samples across 15 sampling events over 10 years, manual comparison becomes impractical. You're looking at dozens of laboratory certificates, consultant reports, Excel files, and summary tables. Cross-referencing every value against every document would take weeks.
Most people don't try. They trust that QA/QC caught analytical errors and assume transcription was accurate. That's a reasonable assumption most of the time. But "most of the time" leaves enough errors undetected to matter.
We've reviewed investigations where 3-5% of reported values didn't match source documentation. Not analytical uncertainty or rounding differences, but clear transcription errors: values from different samples, concentrations off by orders of magnitude, results copied from preliminary rather than final reports.
At 5% error rate across 800 samples analyzed for 20 analytes each, that's 800 incorrect values in your dataset. You won't catch all of them through manual review. You might not catch any of them unless something looks obviously wrong.
External databases and data management systems don't solve this problem. They store whatever data you give them. If you entered transcription errors when loading the database, those errors persist indefinitely. Accessing your data through a third-party platform doesn't validate its accuracy—it just makes incorrect data easier to query. The database is only as reliable as the data entry process that fed it.
Cross-Document Validation with AI
Document processing AI can extract data from PDFs regardless of format. Tables, text, scanned images—it identifies chemical names, concentrations, units, sample IDs, and laboratory metadata. More importantly, it can compare extracted data across document types and flag inconsistencies.
Upload a laboratory COA, a consultant report, and an Excel file. The system extracts sample results from all three sources and identifies discrepancies:
- Sample MW-7 shows benzene at 1,200 µg/L in the COA, 120 µg/L in the report table, 1,200 µg/L in Excel
- Sample MW-12 appears in the COA and Excel file but is missing from the report
- Report Table 3 shows naphthalene results for BH-8, but the COA indicates naphthalene was not analyzed for that sample
- Excel file lists sample collection date as August 14, 2023; COA shows August 4, 2023
These aren't analytical issues. They're documentation issues. The laboratory analysis was fine. The transcription introduced errors.
Traditional QA/QC doesn't catch this because it operates at the analytical level, not the documentation level. Chain of custody verification confirms that the laboratory received and analyzed the samples. Duplicate analysis confirms precision. Spike recovery confirms accuracy. None of these checks verify that data was transcribed correctly from laboratory certificates into consultant reports.
Finding the Source of Truth
When documents disagree, AI can't automatically determine which is correct. That still requires professional judgment. But it can identify which document is likely the primary source.
Laboratory certificates are generated directly from LIMS (Laboratory Information Management Systems). They're the first documentation produced after analysis. Absent laboratory error, they're the most reliable source.
Consultant reports are derivative. They summarize and reformat laboratory data. Errors introduced here are transcription errors.
Excel files are furthest removed from the source. They're often compiled from multiple sources, reformatted repeatedly, and updated piecemeal. They're useful for analysis but problematic as authoritative records.
When the COA shows one value, the report shows another, and Excel shows a third, the hierarchy is straightforward: trust the COA, verify the discrepancy with the laboratory if needed, and correct the downstream documents.
The challenge is identifying these discrepancies in the first place. With thousands of data points across dozens of documents, you need automated comparison.
How Statvis Handles This
Document processing AI extracts data from PDFs and compares it across document types. Upload laboratory certificates as they arrive. Upload consultant reports when received. The system indexes all of them and flags discrepancies automatically.
For existing investigations, bulk upload works. Point the system at a directory of PDFs and spreadsheets, and it extracts and cross-references the data. The output is a list of samples where values differ across documents, ranked by magnitude of discrepancy.
Small differences (rounding, significant figures) get de-prioritized. Large discrepancies—values differing by orders of magnitude, samples missing from documents, results attributed to wrong locations—surface first.
This doesn't replace manual review. It focuses that review on the samples and values most likely to contain errors. Instead of spot-checking 5% of 3,000 data points, you can systematically verify the 150 data points where documents disagree.
Data inconsistencies across documents accumulate quietly: a column shift here, a transposition there, a value pulled from an outdated version. Enough small errors, and your site characterization drifts from reality. Cross-document validation surfaces them before they make it into regulatory submissions or discovery.