
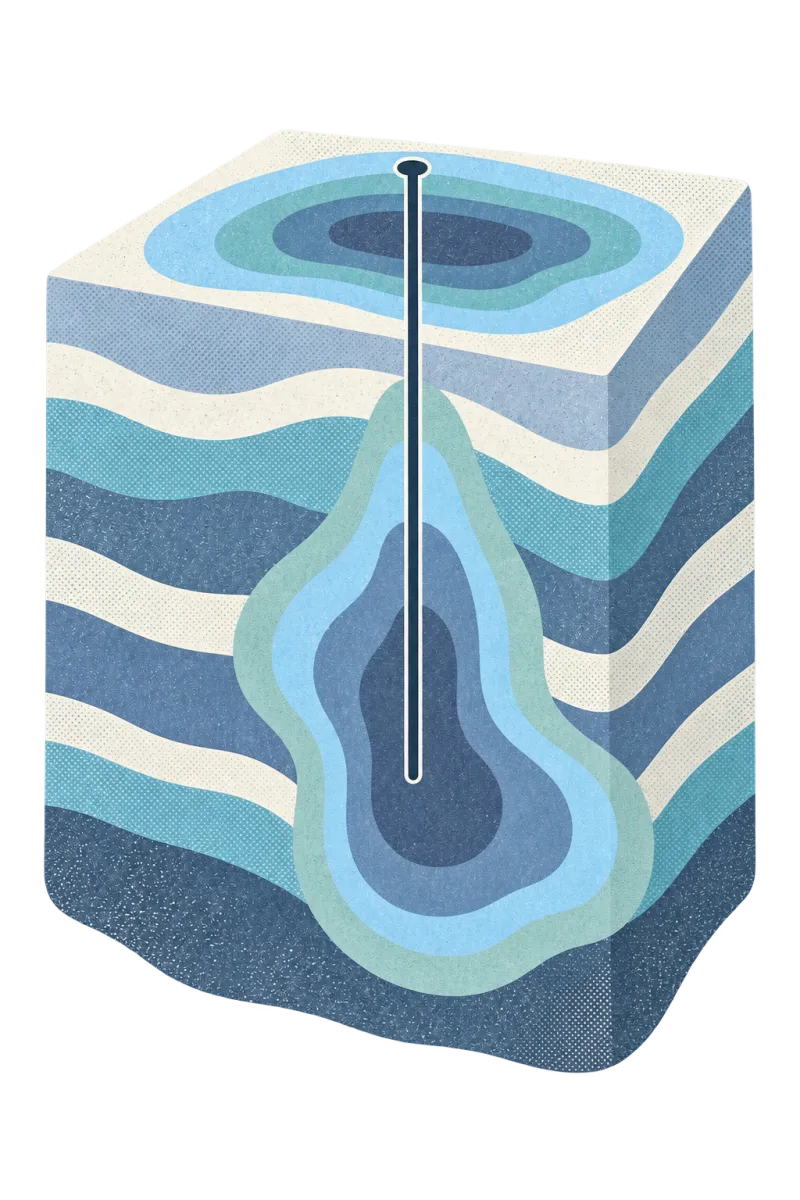
See the plume in 3D. Know the volume before you dig.
Interpolate every layer from the data you have already screened, see the plume in three dimensions, cut a cross-section anywhere, and get contaminated volumes by layer and concentration band.
Interpolate every layer. See the plume in 3D.
Statvis interpolates results for each soil layer and stacks them on the real map, so you can orbit the plume and see where it sits relative to buildings, roads and property lines.
- Interpolation for every chemical and layer
- Shown on the real basemap in 3D
- No extrapolation beyond the data
Draw a line. See the plume in cross-section.
Draw a line across the plan view and Statvis builds the cross-section along it, layer by layer, so the vertical extent of impacts is clear to anyone reading the figure.
- Cross-sections along any line
- Every layer and band shown
- Built from the same interpolation as the map
Contaminated volumes, calculated layer by layer.
Volumes are calculated for each guideline band and soil layer as you toggle them, giving you defensible quantities for remedial options and cost estimates.
- Volumes per exceedance band
- Per soil layer, toggled live
- Undelineated areas called out
Related
Back to mappingMapping
Groundwater trends
A Mann-Kendall trend for every well, and the plume over time.
Read moreReporting
Reports, tables and figures
Exceedance tables, standard figures and cited deliverables.
Read moreForensics
Environmental forensics
PFAS, PAH and salt fingerprints that separate sources and background.
Read moreTake control of your contaminated sites.
Bring us one site's documents. We'll show you what's in them.