
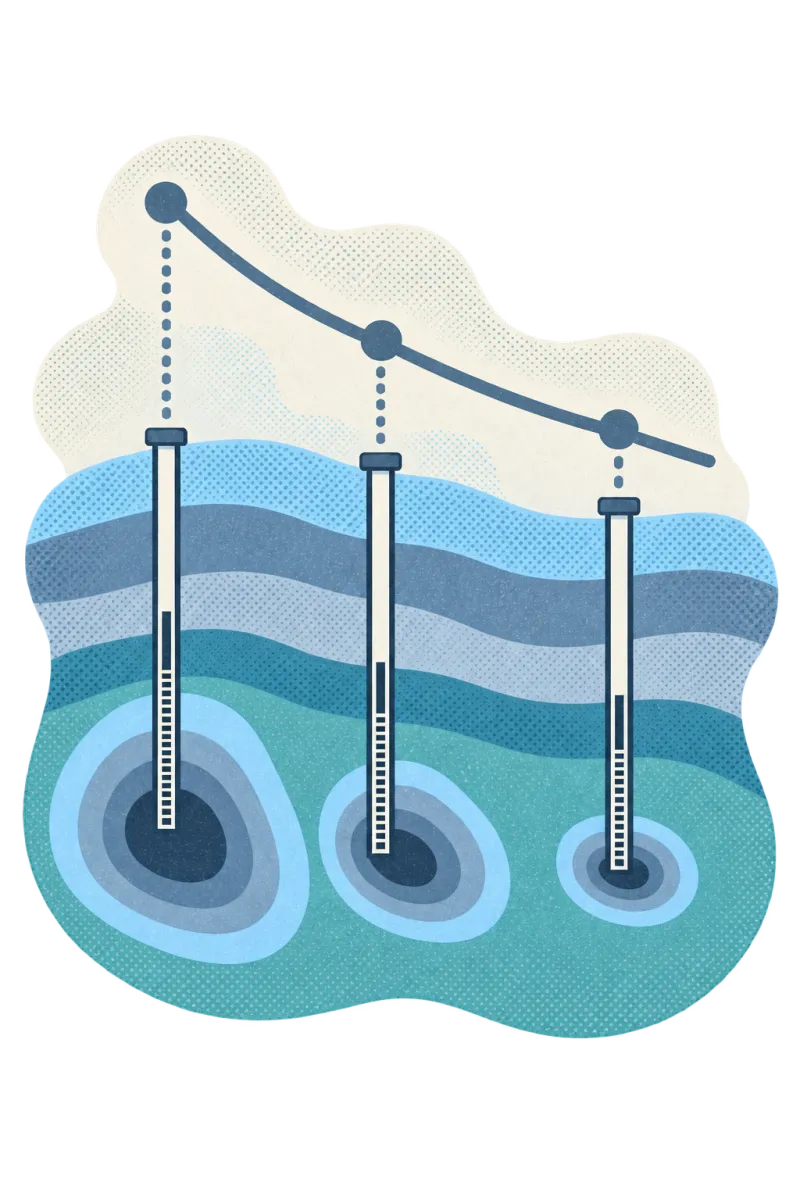
Is it getting better or worse? A trend for every well.
The question regulators always ask. Statvis runs GWSDAT-style trend analysis on every well, for every analyte, from monitoring data that may span a dozen events and several consultants.
Test every well for a trend. See the plume shrinking, or not.
Run Mann-Kendall trend tests and fitted trends across every monitoring well at once, then isolate any well to see its direction, significance and half-life.
- Ready for monitoring reports
Every well, every constituent. One table.
A traffic-light table shows every well against every constituent over time, with trend classes and thresholds, so you can see where the plume is shrinking and where it is not.
- Trend classes per well and constituent
- Statistical and absolute thresholds
- Scrub through monitoring dates
Per-well analysis includes
- Smoothed concentrationa local trend line through every event
- Linear trendwith confidence interval and half-life
- Mann-Kendallp-value for a monotonic trend
- Non-detectsmarked, not dropped
Watch the plume over time. Area, mass and average, by date.
Plume animation shows the concentration surface changing across monitoring events, with the plume boundary at your chosen threshold.
Plume diagnostics
- Areainside the threshold boundary
- Massestimated across the plume
- Averageconcentration within the plume
- Flowdirection overlaid on the map
Related
Back to mappingMapping
3D mapping and volumes
Plumes in 3D, cross-sections and contaminated volumes by layer.
Read moreSite history
Site history
Every event in the site file, found, dated and cited.
Read moreReporting
Reports, tables and figures
Exceedance tables, standard figures and cited deliverables.
Read moreTake control of your contaminated sites.
Bring us one site's documents. We'll show you what's in them.